It's fun being a generalist. Here's a look at a typical year at Funnel Inc. where we get assignments from almost every industry like transportation, publishing, manufacturing, medical, automotive and even (pinching our noses now) water treatment. We top it off with a book for Chronicle and a mention in Taschen's Information Graphics.
ILLUSTRATED THE BOOK: STICK MAN'S REALLY BAD DAY by Steve Mockus & Funnel Inc.
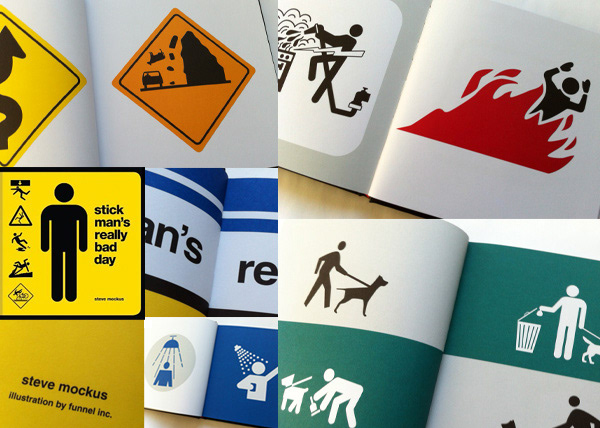
From book description on Amazon: "Stick Man is that guy you see around town but don't really know very well. Everywhere you go, there he is, crossing the street, waiting for the bus, issuing warnings about potential disasters at sea and on land, at the mall and at work. But when he's not offering advice, what does a day in the life of Stick Man actually look like? This catastrophe-packed book uses images derived from real signs to follow a continuous narrative as Stick Man navigates the perils of a single, hilariously bad day. "
AIRPORT MAP
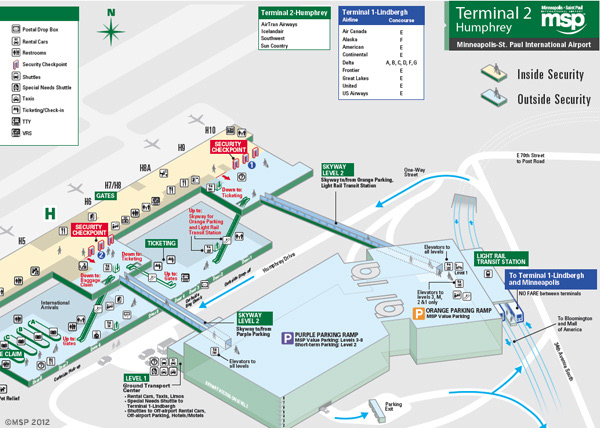
Detail from a printed "quick map" for Terminal 2 at the Minneapolis St. Paul International Airport
EDITORIAL INFOGRAPHIC (ENVIRONMENTAL)
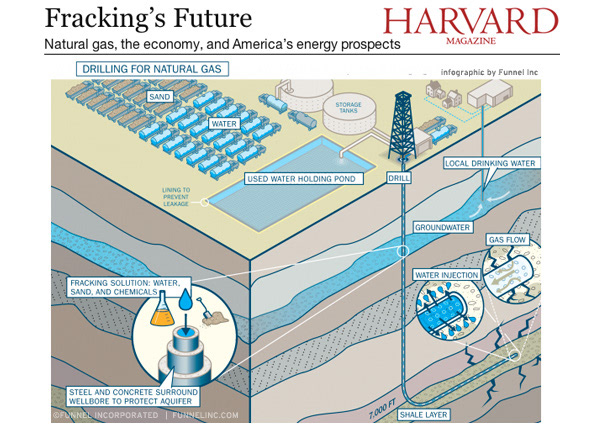
Infographic about fracking for Harvard Magazine
ICON FOR ANIMATED BILLBOARD
INSTRUCTION DESIGN FOR BIKE COMPUTER
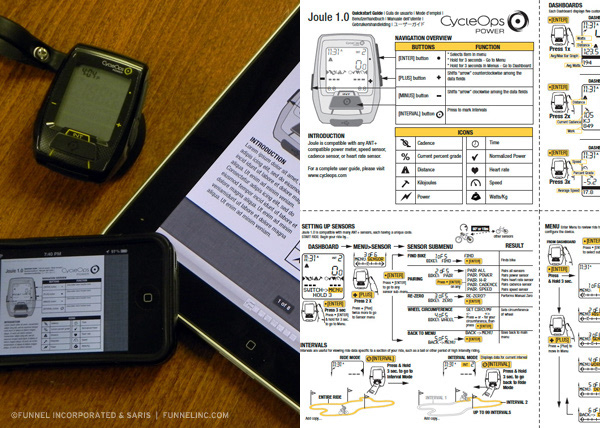
Instructions for the "Joule" bicycle computer - Client: Saris CycleOps
SOCIAL MEDIA INFOGRAPHIC
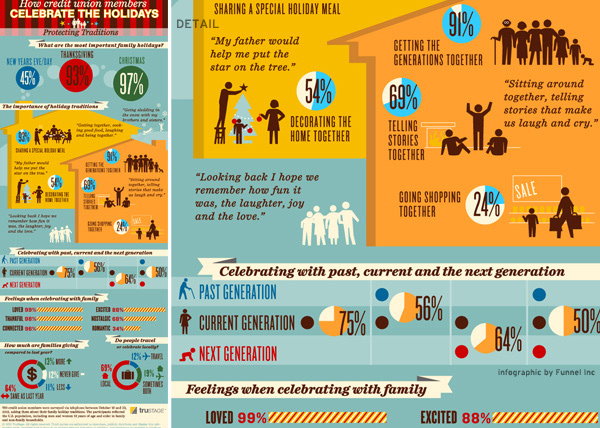
Detail from an infographic about holiday traditions - Client: LSB / Brand: Trustage
INFOGRAPHICS FOR AWARENESS OF ISSUES & PROPOSALS
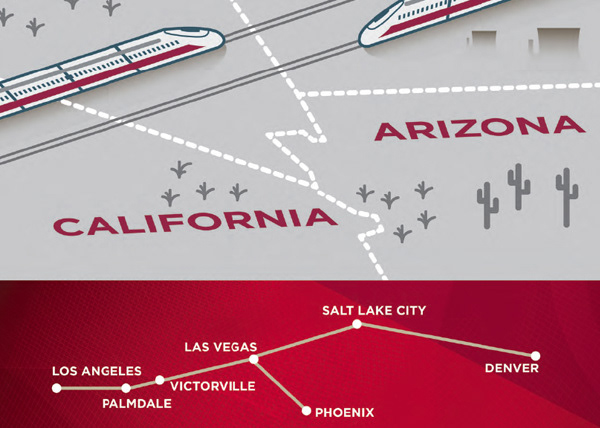
Detail from an infographic project with a goal of raising awareness and support for a high speed rail project from California to Colorado.
MAP (DETAIL) OF THE LAS VEGAS "STRIP"
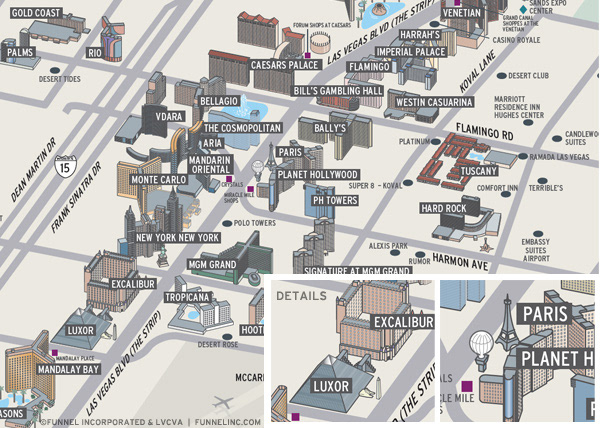
Map showing main casinos, streets, hotels and roads - Client: R&R Partners / Brand: Las Vegas Convention and Visitors Authority
EDITORIAL INFOGRAPHIC (MANUFACTURING)
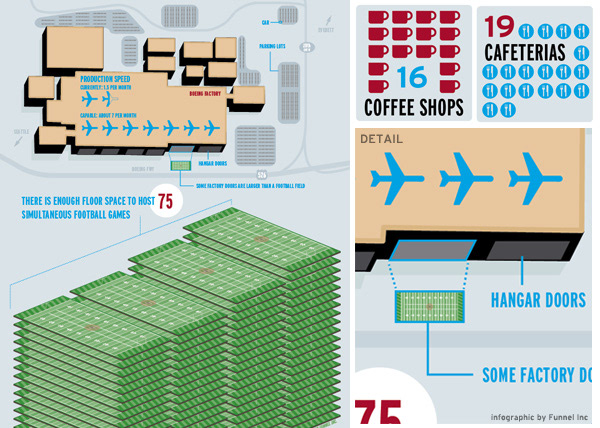
Infographic to explain the size of Boeing's airplane assembly plant for AOPA Magazine
ELEMENTS FOR AN INTERACTIVE MODULE
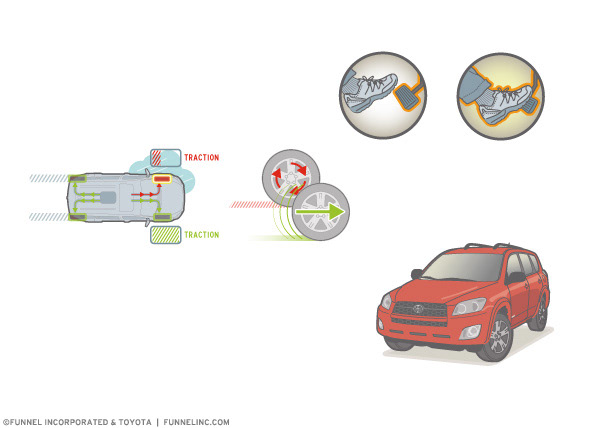
Details from an interactive module featuring selling points of the new Toyota RAV 4 - Client: 22 Squared / Brand: Toyota
EDITORIAL INFOGRAPHIC
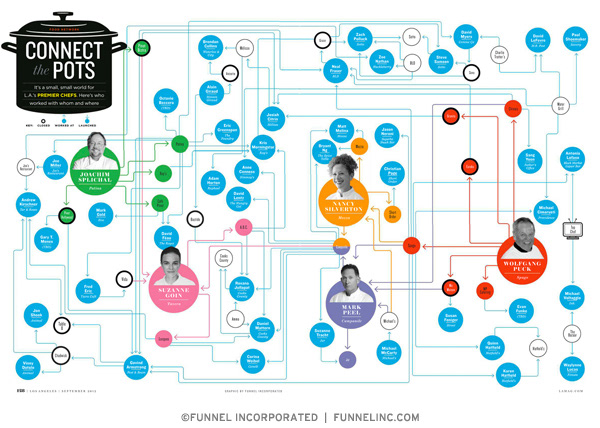
Infographic about career paths of various Los Angeles-based restaurant chefs - Client: LA Magazine
INFOGRAPHIC FOR AN ACCOUNTING FIRM TO LEVERAGE TAX LAW FOR THEIR ENERGY & AG CLIENT
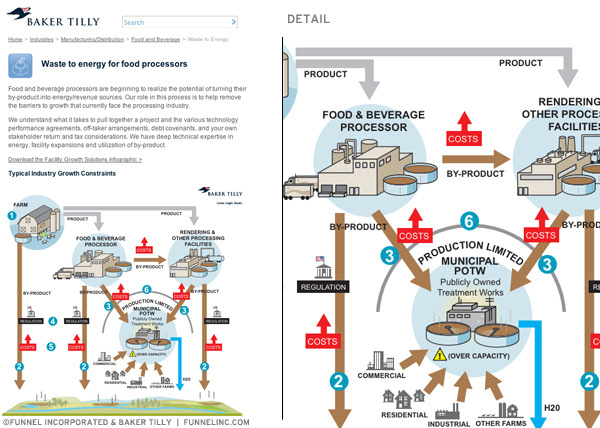
Infographic to explain a financial scenario that uses tax credits and other advantages to convert waste into energy for manufacturing clients - Client: Baker Tilly
FEATURED IN THE BOOK: INFORMATION GRAPHICS by Sandra Rendgen & Julius Wiedemann | TASCHEN
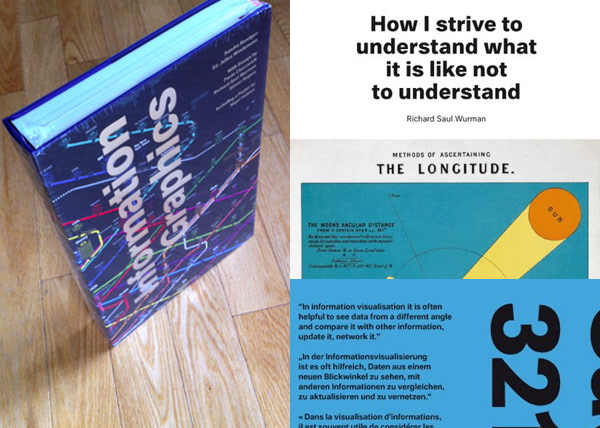
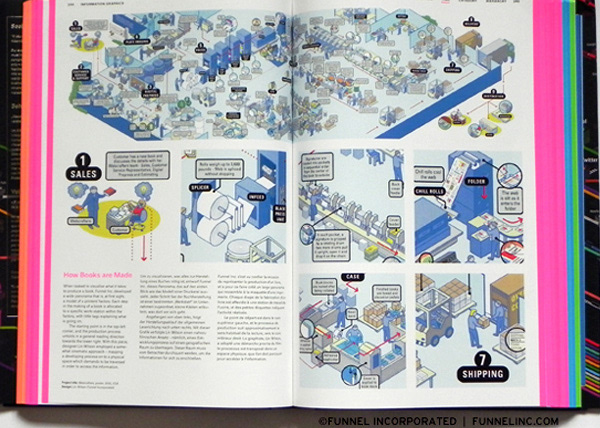
We were honored to be featured in Taschen's Information Graphics alongside Richard Saul Wurman and Nigel Holmes.
Reviews:
"Sometimes simplicity is far harder to achieve than complexity. That is where design comes in. This book, a design nerd's fantasy, comes at the perfect time. BoingBoing dubbed it "a new TASCHEN porn book you can't live without," and we agree."
- Huffingtonpost.com, New York, United States
“Count on TASCHEN to tackle a big conceptual challenge with a big, beautifully designed book... exploring four key aspects of visualizing data — Location, Time, Category, and Hierarchy — through exemplary work from more than 200 projects, alongside essays by information architect and TED founder Richard Saul Wurman, Guardian Datablog editor Simon Rogers, Density Design’s Paolo Ciuccarelli, and (Sandra) Rendgen.”
- Brainpickings.org, New York, United States
Buy the book (Amazon):